- Is there a feature with an under-utilized usage, that we can lower its limit in order to increase conversion to higher tiers?
- Is there a feature with over-utilized usage, that we can further monetize by introducing add-ons or additional plans?
Start inspecting today
To inspect a feature, click on the Dashboard > Feature inspector item from the left navigation pane. Select a feature that’s metered by Stigg from the top-left drop-down menu.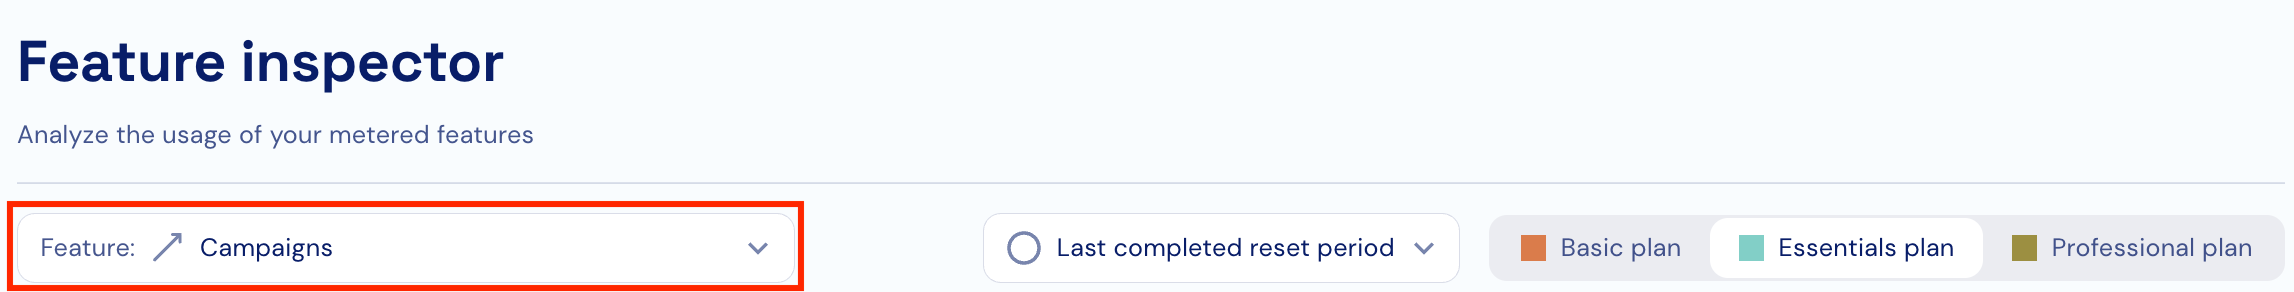
Gain insights from different angles
The feature inspector is composed of 3 views:- Distribution of the number of customers according to their usage
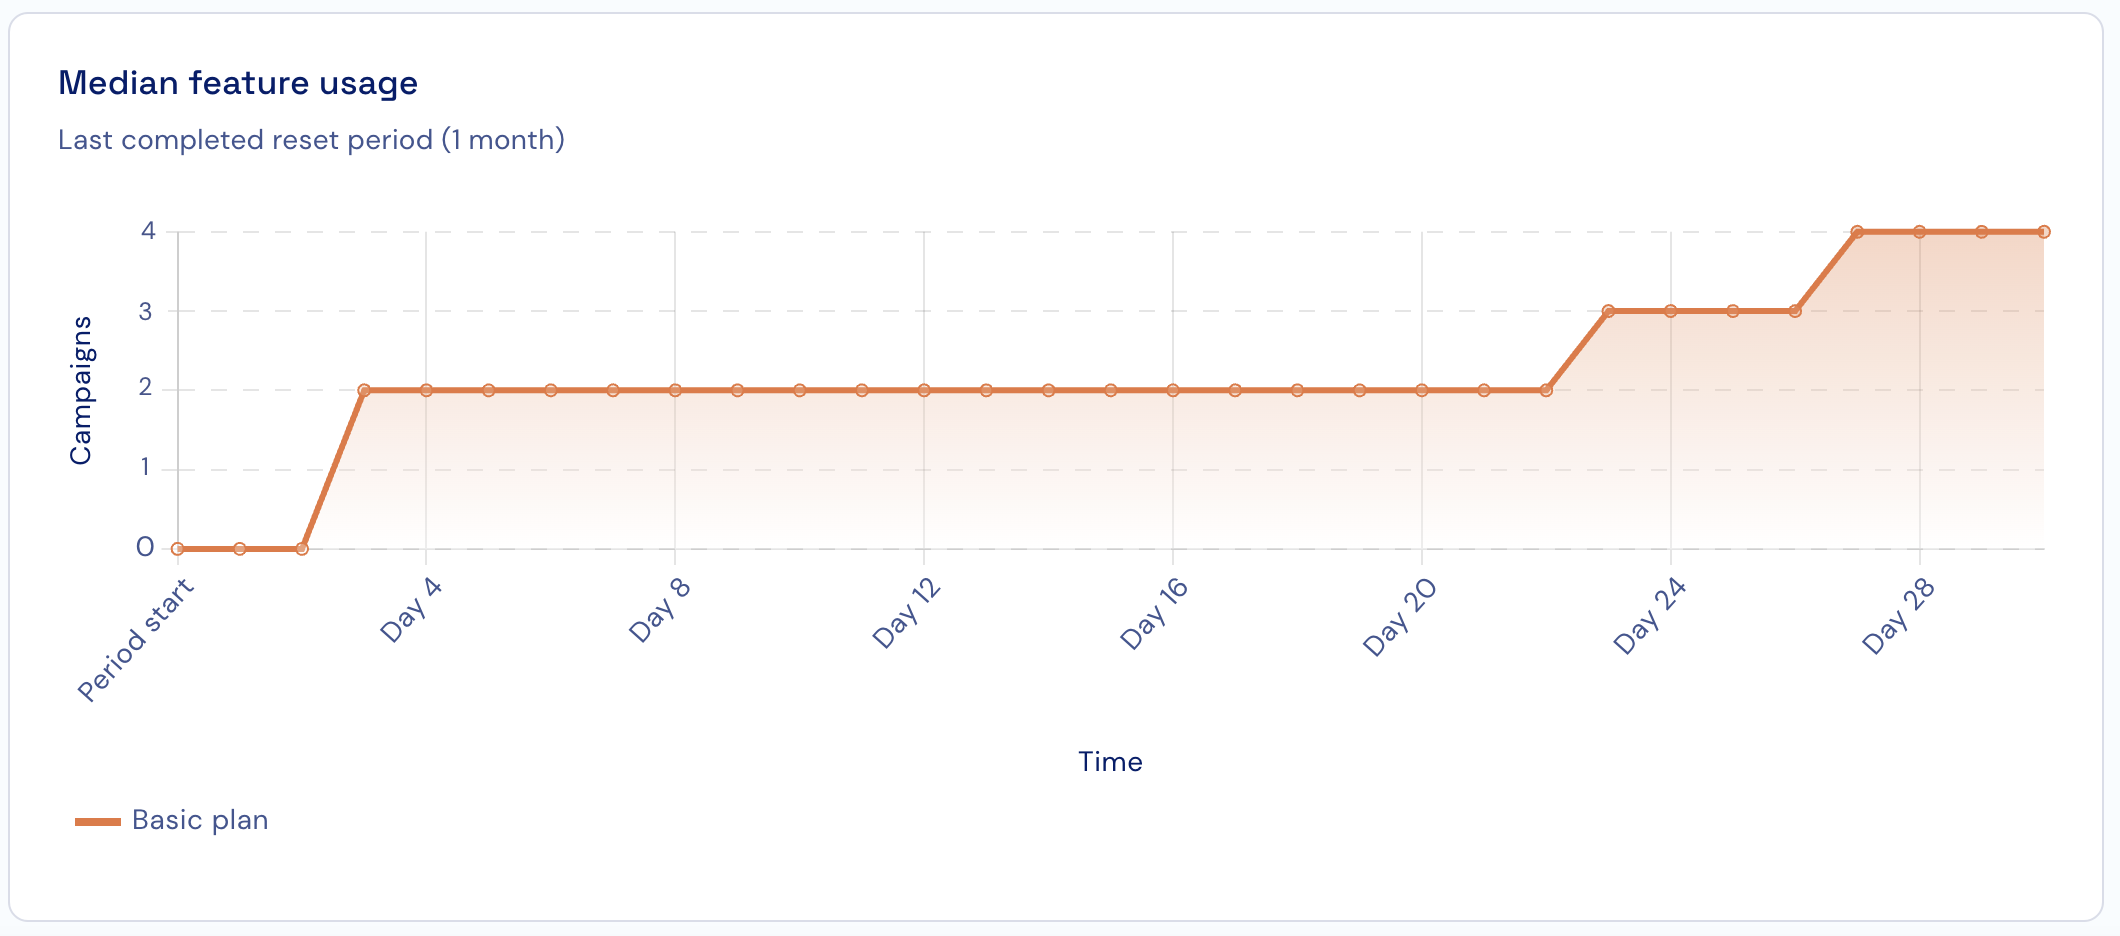
- Visibility for the median feature usage over time
- Visibility for the customers with the top usage
Customer usage distribution
This chart provides insights about the distribution of the number of customers according to their usage, as well as whether the limits that you’ve defined as part of your existing pricing model are optimal or can be improved in order to increase conversion. Examples for such use-cases include over- and under- utilized features.Under-utilized features
An under-utilized feature, that can be leveraged to increase conversion by lowering its limit: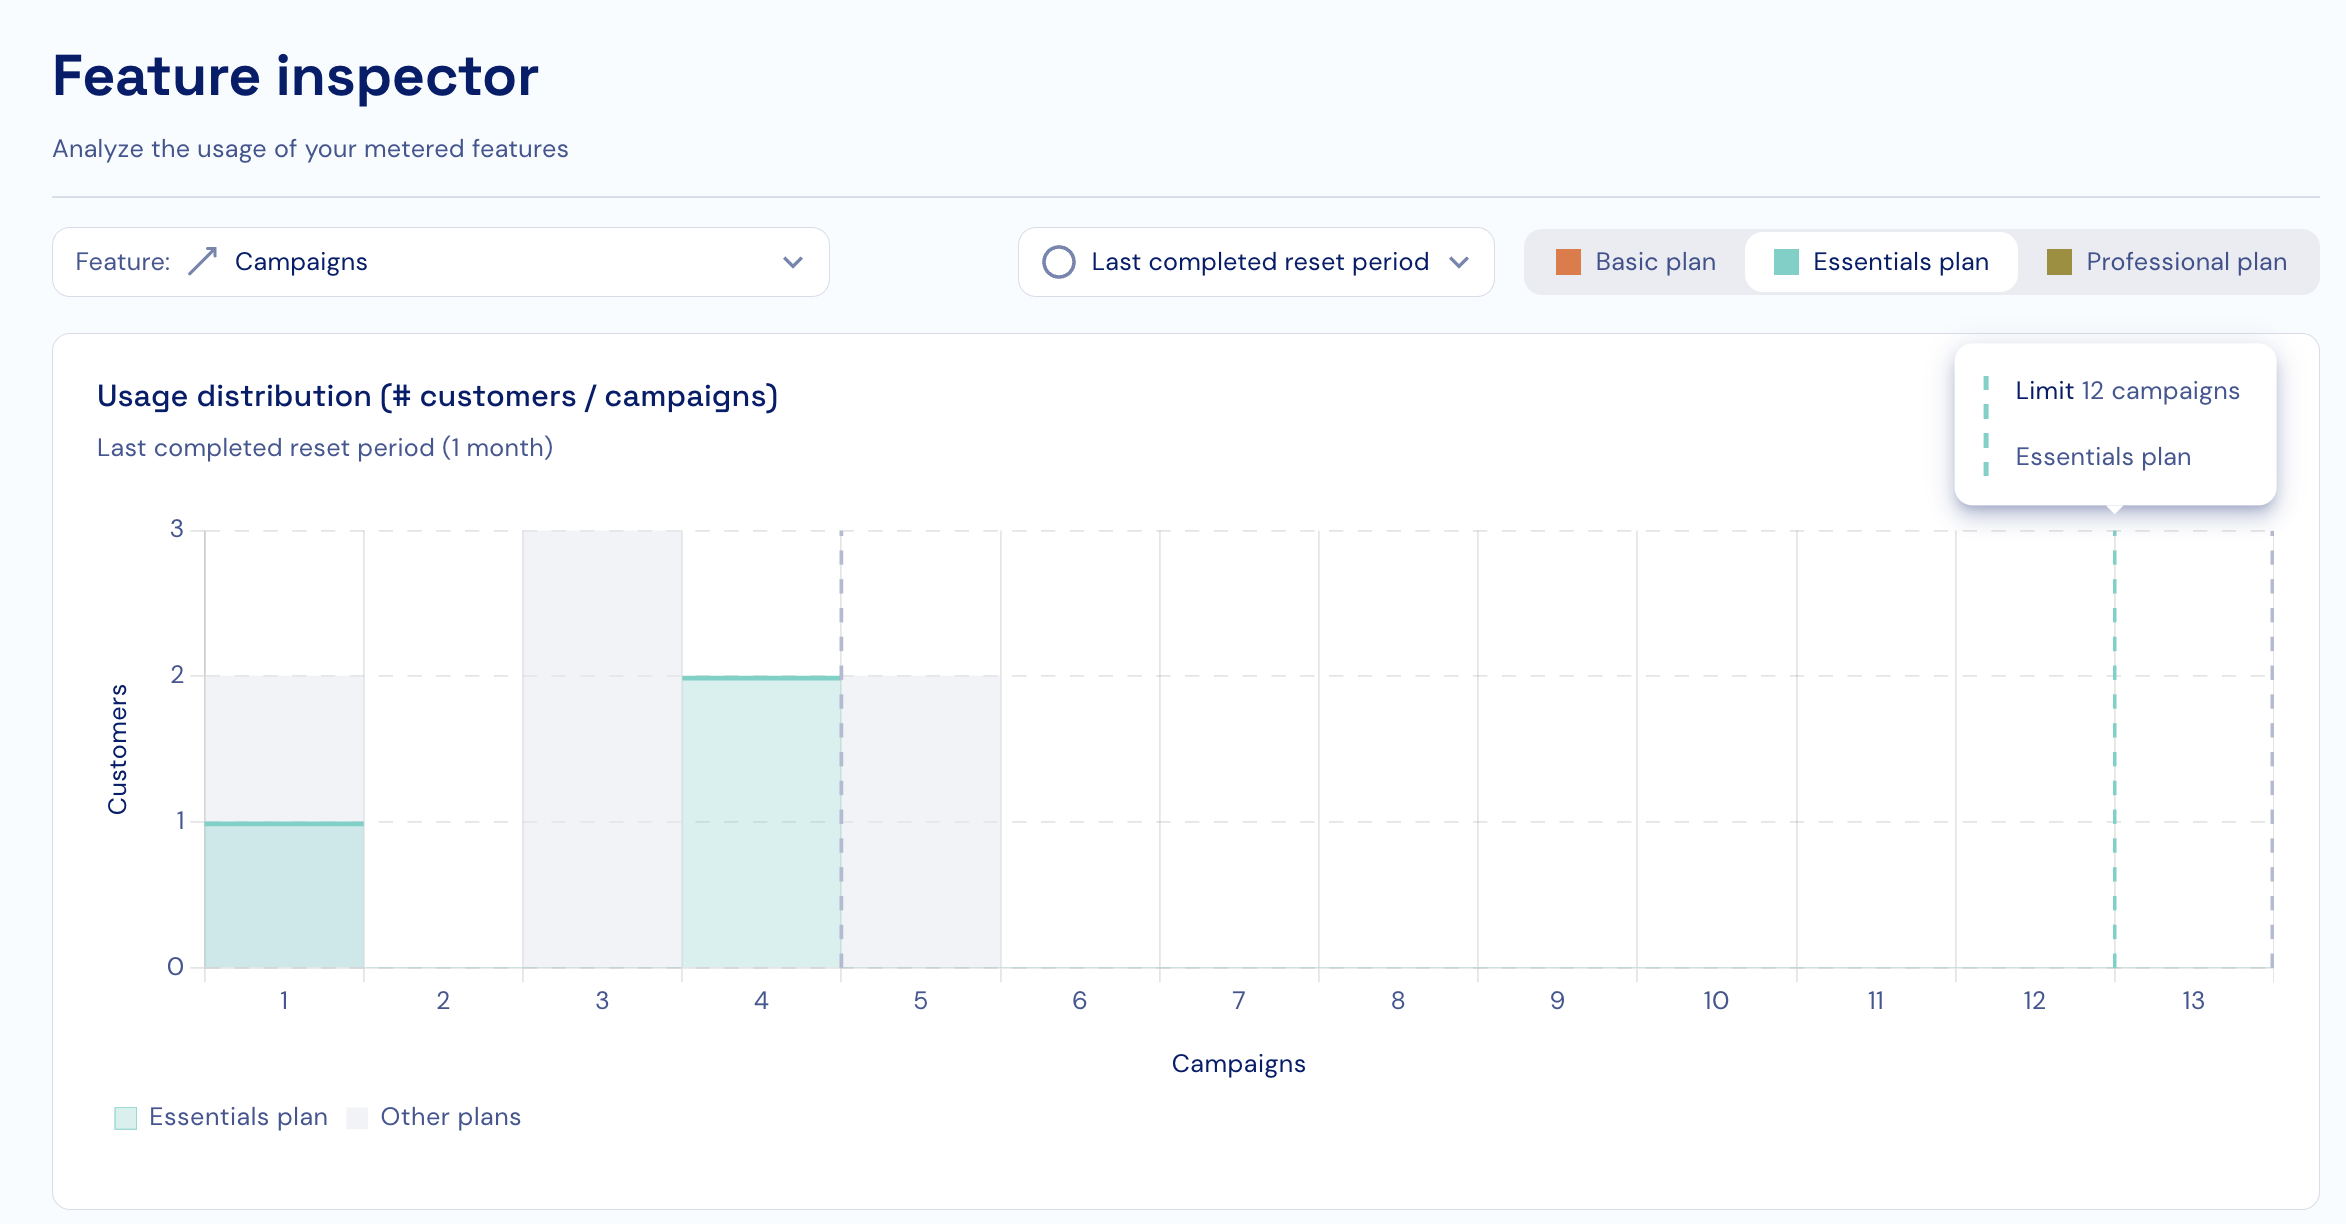
Over-utilized features
An over-utilized feature, that can further be monetized by introducing add-ons and new plans: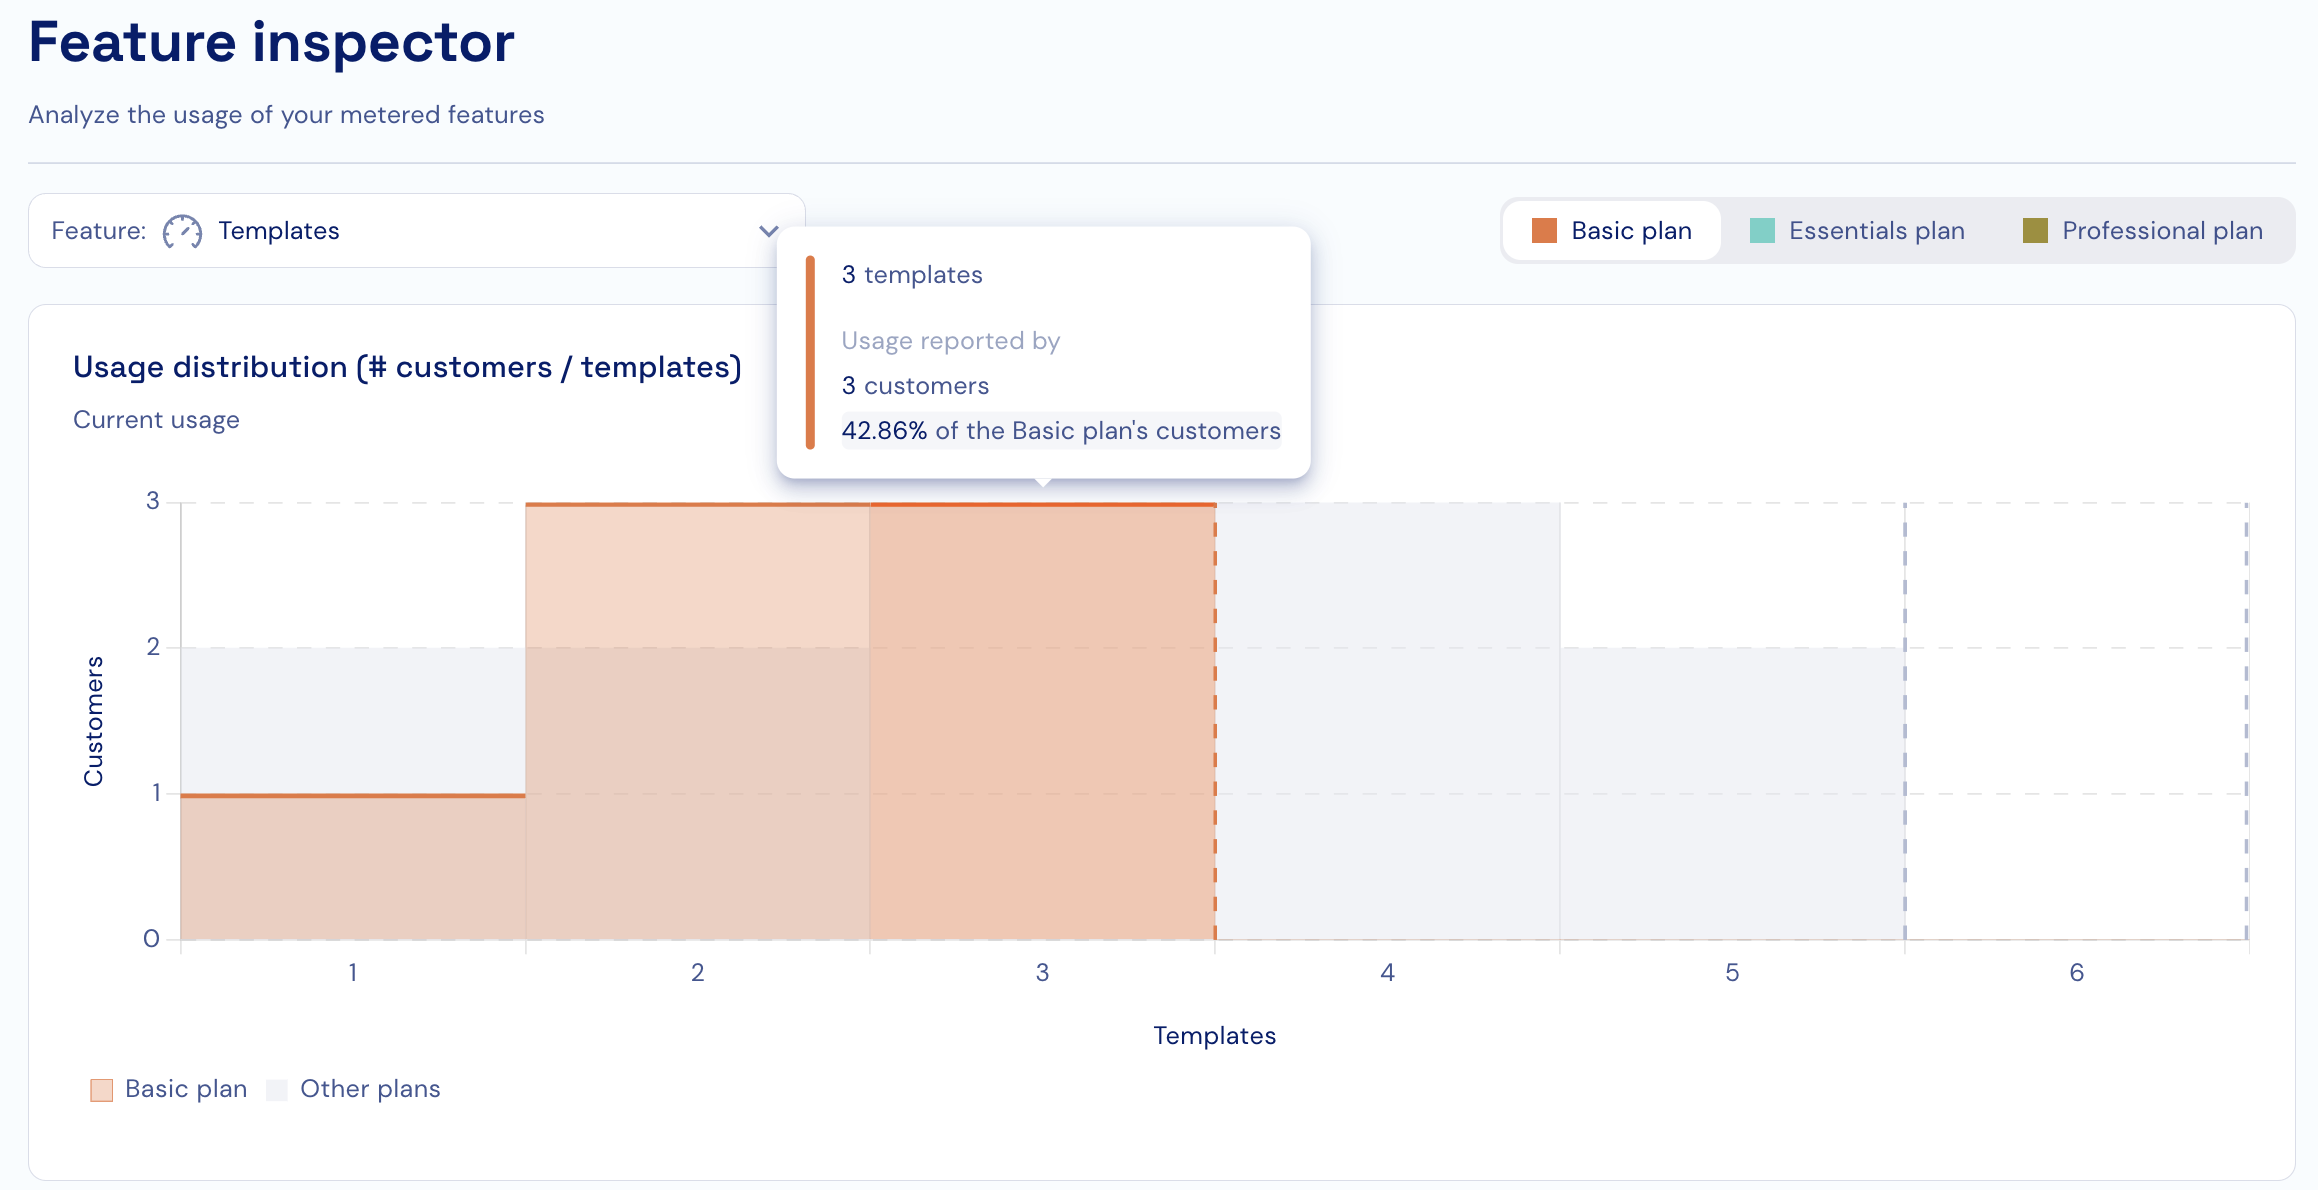
Median feature usage over time
This chart serves as a “heartbeat” to the usage of the feature over time. For metered features without an automatic reset period (i.e. seats), the report period is for the last 30 days., the chart provides visibility for data from the last 30 days.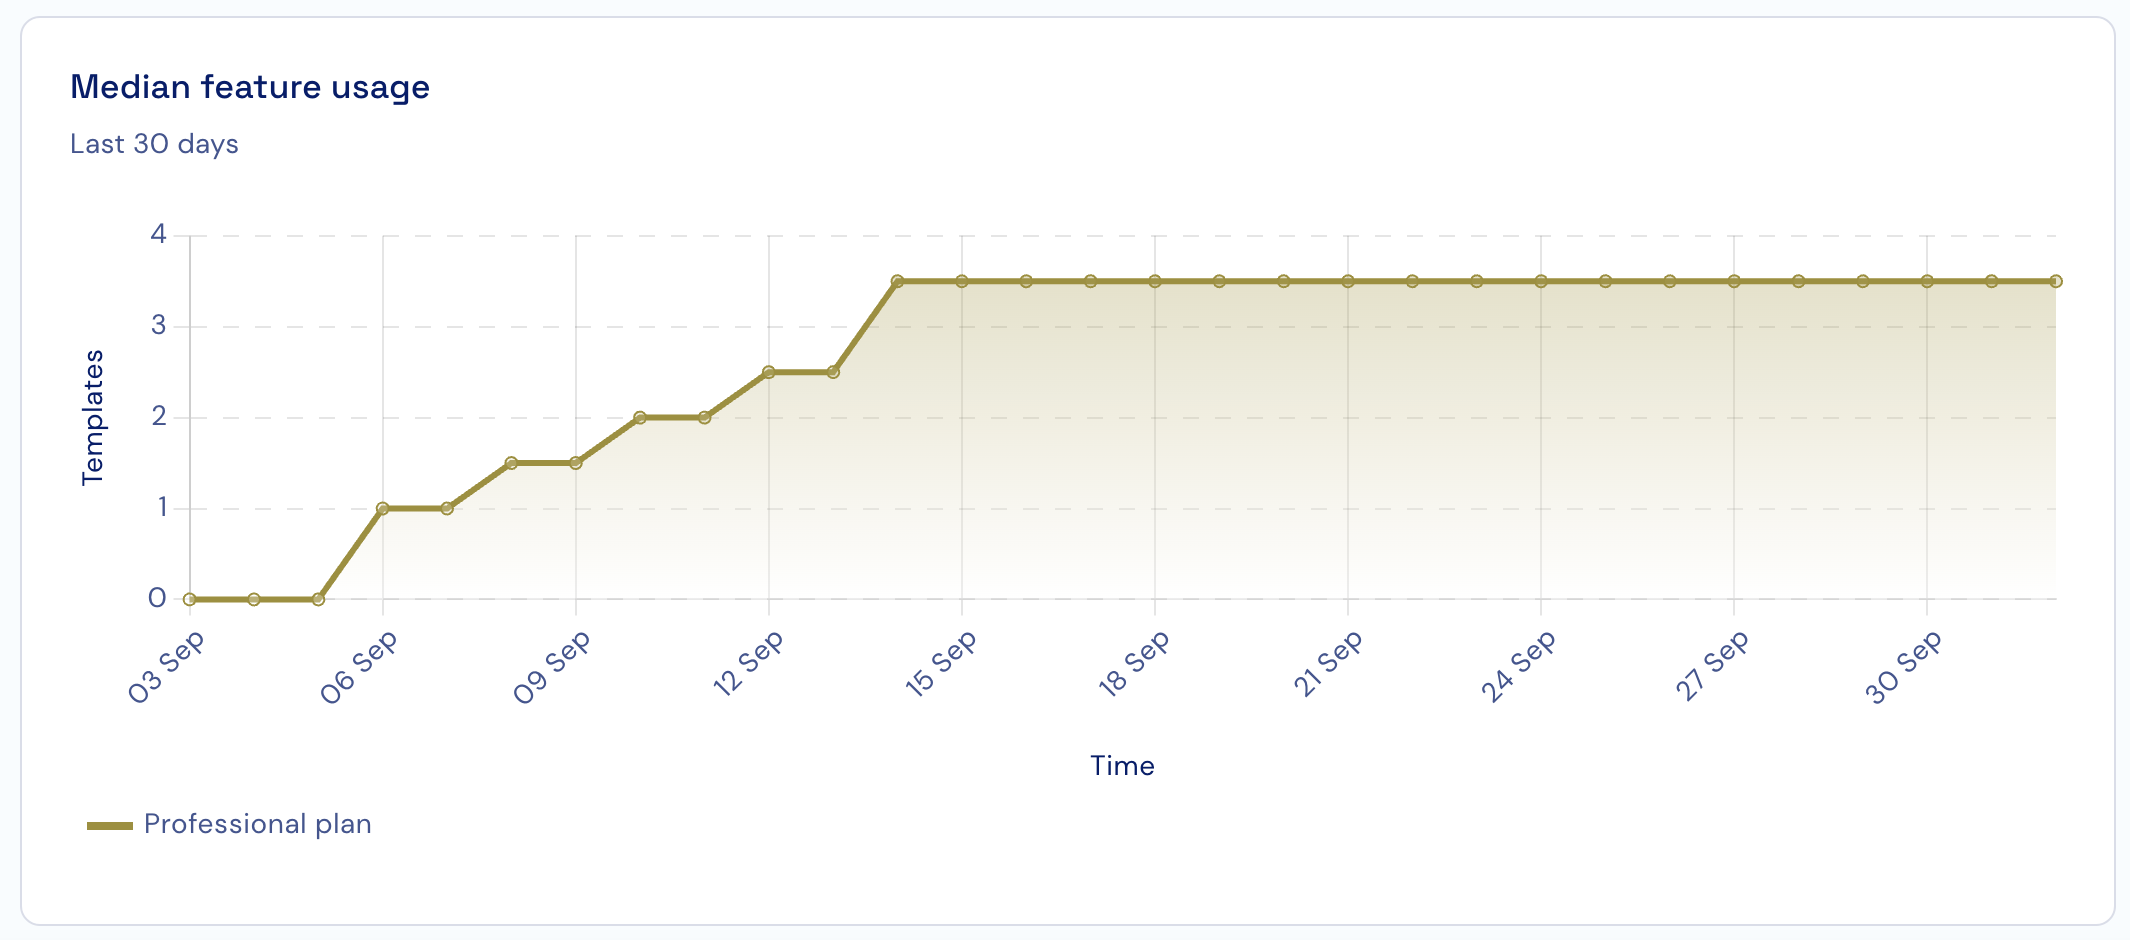
Top customer usage
This chart helps you quickly identify the top customers that have adopted and are using the feature. Clicking on each bar will take you to the relevant customer in Stigg.
Focus on each plan
On the top-right corner you can select the plan that you’d like to focus your inspection on. When the relevant plan is selected, the usage of its customers and the plan’s limit will be highlighted in the plan’s color.
Report period
For metered features without an automatic reset period (i.e. seats), the report period is for the last 30 days. For metered features with usage that’s automatically reset by Stigg, (i.e. active users / month, API calls / month, etc.) it’s possible to view the data from to the last completed reset period or the current incomplete reset period.Data freshness
Dashboard data is refreshed in a background cycle and may take up to 24 hours to update. If you’re not seeing expected values right away, please allow time for the refresh process to complete.
Limitations
- The shown data doesn’t include customers that didn’t report any usage.
- When customers upgrade from one plan to another, their usage is taken into consideration in all of the plans that they had subscriptions for during the report period.
- Event-based metered features are not currently supported in the Feature Inspector. Only metered features that use reported usage as their data source are included in the dashboard views. We recommend using reported usage meters if you want visibility into feature adoption and usage patterns through the Feature Inspector.
- In Sandbox environments, the Feature Inspector does not display real usage data. The data shown is limited to the mocked data that is automatically populated when the Sandbox environment is created.